IN THIS SECTION
- Overview
- Using Layouts
- Layout List page
- Types of Layout
- Editing Layouts
- Changing the layout name
- Searching/Filtering within a layout
- Moving and copying accounts between groups
- Adding/Editing Groups, Formulas and Charts
Overview
Layouts allow you to tailor the Joiin Financial Reports and layout the data as you require - each layout can be saved and run as and when needed or used within Report Packs. Layouts can be used for many purposes including:
- Creating custom layouts to meet statuary form requirements, e.g. GAPP, IFRS
- Consolidating accounts with different codes/names into a single line
- Performing calculations and presenting the results as a single item (e.g. KPI)
- Creating KPIs for display on Dashboard widgets or in Report Pack Charts
- Displaying charts summarising report data
With layouts you can:
- Add, rename and delete groups
- Move accounts between groups
- Set groups to display Debit or Credit accounts as positive
- Control how results and totals are displayed for a particular group
- Hide groups - handy if you only want to see certain accounts/formulas in the report results
- Add, rename and delete formulas
- Change formulas to perform calculations with the totals from groups, other formulas and raw numbers
- Make a Group or Formula available as a KPI for use in a Dashboard or Report Pack
- Add charts
- Create a Copy of an existing layout
- Move groups and formulas up and down in the report and nest them in other groups
Using Layouts
You can choose a Layout to use when running a report and you can create and edit custom layouts.
Ways you can access Layouts
You can select, create or edit Layouts from several places:
Running a Financial Report
When you run any of the standard financial reports (Profit & Loss, Balance Sheet etc.) you can select the layout from the Report layout dropdown. By default, the Built-in Layout for that report will be used. Click on the Select layout icon on the right of the Layout dropdown to bring up the Layout Selector where you and you can select, create, edit or delete a custom layout. If you are viewing a custom layout you can also click on the Edit icon on the right of the Layout dropdown to go directly to edit that layout. See the Layout Selector section below and Running Reports article for more information.

Building a Report Pack
When you're viewing or editing a Report Pack you can select the Layout of a Report by clicking on the Edit Report Layout icon on the report toolbar at the top right of the report - from there you can select, create and edit layouts. Alternatively, when adding a new Report you can select the desired layout - or create, edit or delete layouts from there. See the Report Packs article for more information.
Layouts List
You can view a list of all Layouts through the Layouts item on the top-right Settings menu. From there you can Run a financial report using that Layout by selecting the Run icon to the right of the Layout. This will run the associated report via the Financial Reports menu, using the previously saved filters as normal.

You can also click on a Layout to edit it - or delete, duplicate and copy layouts between clients (see below).
Selecting and Editing Layouts
When you access layouts through a financial report or Report Pack you will see the Layout Selector pane on the right. This will show all the available Layouts for the type of Report being viewed (see Types of Layout below). The currently selected layout will be highlighted. Here you can choose the Built-In Layout or from one of the Custom Layouts, should they exist. Simply click on the Layout name to select it - the Report will be re-generated using that Layout.

To Edit one of the Custom Layouts click on the Edit icon on the Layout you wish to edit.
To Create a new Layout click on the Create from built-in button and select the built-in layout as required. A new layout will be created based on the built-in layout and you can edit it from there.
To Delete a Custom Layout click on the Delete icon on the Layout you wish to delete.
When you create a new layout you will start with the Built-in Layout of the type of report being viewed (see table below). From there you can make changes to the layout as described further in this guide.
Automatically Added Accounts
When new accounts are added to your Chart of Accounts - for example, because a new account was created in your accounting system or a new entity was added to Joiin - Joiin automatically places them into your layouts using Auto Include Rules.
These rules determine which section (e.g. Revenue, Cost of Sales, Expenses, etc.) each new account should appear in, based on its account type, name, or system mapping.
NOTE: If a default section from the original layout (such as Revenue or Cost of Sales) has been removed, it may be recreated automatically when a new matching account appears.
For a full explanation of how Auto Include Rules work - including the different rule types and when they apply - see this article.
Layout List page
Once you've created and saved a Layout you can access it again through the Layouts item on the top-right Settings menu.
- Select Layouts from the Settings menu - a list of previously saved layouts will be displayed
- The Type of Layout, the date is was last modified and a count of how many Report Packs the layout is used on will be displayed.
- Click on the Run button to the right of the report to run that layout through the Financial Report menu.
- Click on the layout name to edit the layout
- Click on the Delete button on the right of the report to delete the layout
- Click on the Duplicate button on the right of the layout to create a copy of an existing layout
- If you have multi-client enabled, click on the Copy to Client option to copy that layout to another client - select the client you wish to copy the report to, amend the name if necessary and click Copy
You can also create a new Layout from here by clicking on the Create Layout button and selecting the type of layout you require.
Types of Layout
You can create different types of layout - the type you choose dictates the type of accounts that are included and the initial layout of the report.
| Type | Financial Report menu item | Accounts Included | Default Layout | New Accounts Added to |
|---|---|---|---|---|
| Profit & Loss | Profit & Loss | Profit & Loss | Profit & Loss | Default P&L Groups: Revenue, Expenses, Cost of Sales, Other Income, Other Expenses |
| Balance Sheet | Balance Sheet | Balance Sheet | Balance Sheet | Default Balance Sheet Groups: Current Assets, Non-Current Assets, Current Liabilities, No-Current Liabilities, Equity |
| KPI | KPI | P&L and Balance Sheet | KPI | Default P&L and Balance Sheet Groups |
| Cashflow | Cashflow | P&L and Balance Sheet | Cashflow | Default Cashflow Groups: Operating Activities, Financing Activities, Investing Activities, Cash |
| Combined P&L, BS | Combined | P&L and Balance Sheet | P&L + Balance sheet, groups only, groups hidden | Default P&L and Balance Sheet Groups |
| Combined P&L, BS, Cashflow | Combined | P&L and Balance Sheet | P&L + Balance sheet + Cashflow, groups only, groups hidden | Default P&L, Balance Sheet and Cashflow Groups |
| EBITDA | Profit & Loss | P&L | Profit & Loss | Default P&L |
Editing Layouts
When you create a new layout or edit an existing layout you enter layout edit mode. Some things to note while you're in this mode:
- In Edit mode the editor will include all accounts from your Chart of Accounts of the type corresponding to the report type. When you run a report with that layout only the accounts corresponding to the selected Companies and other filters will appear.
- You must click the Save button to save any changes you make. The Save button will be greyed out initially but will become active as soon as you make any changes. TIP: We recommend you save often when editing a layout especially if you're making a lot of changes.
- The Save button has a number in parentheses which tells you how many Report Packs this layout is used in. This acts as a warning to make the user aware that if they are adjusting a layout from with a particular Report Pack then it may affect other report packs.
- Once you save a layout, you will be returned to the report/pack you were viewing and the report will be re-generated using that new layout.
- In this guide we refer to the "three-dot" menu by which we mean the icon with three vertical dots that appears on every group and formula which, when you click on, opens up a menu of actions you can perform on that group or formula.
NOTE: If you have Group sub-accounts selected, accounts with colons in their names will be displayed as nested groups in reports but in the layout editor they will appear as a flat list.
Changing the layout name
Simply change the name in Layout Name field and click on Save.
Searching/Filtering within a layout
You can filter the groups and accounts you see when editing a layout in a number of ways. The filter and search boxes at the top allow you to do this.
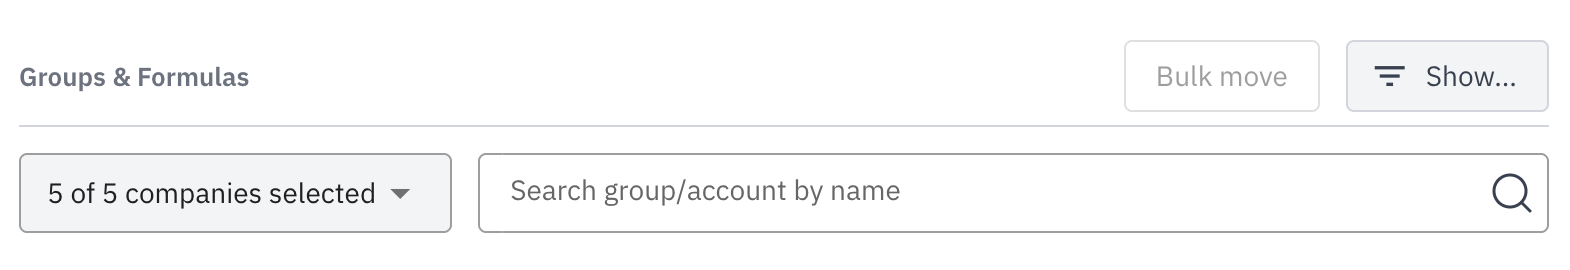
Filter by company
You can select specific companies to filter by. To only show accounts for specific companies select the companies from the dropdown on the left.
Search by name
To search for a group or account simply enter your search text in the search box on the right. Search will be performed across all groups, formulas, account codes and names and the matching items will be filtered as you type.
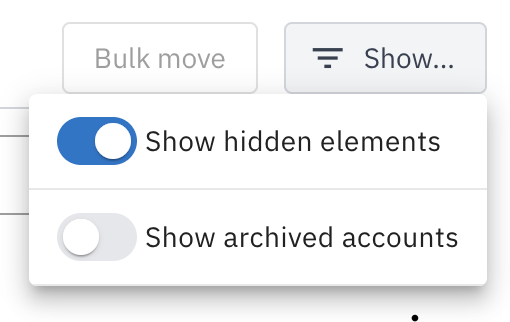
Show hidden elements
Switching this toggle controls whether hidden elements are displayed while editing the layout. Groups and formulas can be hidden so that they are not shown when a report using that layout is run. However, while editing the layout it is useful to see those hidden elements. Use this toggle to hide or display them as required.
Show archived accounts
Use this toggle to show or hide any archived accounts. If you have a lot of archived accounts it can be useful to hide them to reduce the amount of accounts to work with.
NOTE you cannot delete a group unless it is empty and that includes archived accounts so you may need to switch this toggle on to see all archived accounts if you are having trouble deleting a group.
Moving and copying accounts between groups
Accounts can be moved or copied from one group to another in one of the following ways:
One at a time
- Click on the three-dot menu on the right of the account you wish to move
- Select Move to or Copy to
- Select the group to move or copy the account to
- Click on Save to save your changes
NOTE: When you choose the Copy to option, a copy of the account will be created in the target group - this will result in the account appearing in more than one group. You should check this is the desired result. To remove an account from one of the groups you can use the Copy to function again to move it back into the first group.
NOTE: If you have Group sub-accounts selected, be careful when moving sub-accounts as they may then be separated from their intended parent account - always keep all related parent and sub-accounts together in the same group if possible.
Bulk move
- Select the accounts you wish to move by clicking on the checkbox - the Bulk Move box at the top will highlight how many accounts have been selected
- When you've selected all the accounts you wish to move click on the Bulk Move button and select the group you wish to move them to - once moved your selected accounts will be cleared
- To clear all the selected accounts, click on the Bulk Move button and select Clear Selected
- To reselect the accounts you have just cleared click on the Bulk Move button and select Reselect last Cleared - helpful in case you moved accounts into the wrong group accidentally
TIP: you can select more than one account by clicking on the first account - this will highlight it green - then holding the shift button down and selecting the last account - this will select all accounts between the first and las
NOTE: You may need to Expand the group first to see the accounts before you can move/copy them - see Collapse/Expand below.
Adding/Editing Groups, Formulas and Charts
Layouts are made up of Groups, Formulas and Charts.
Groups are report sections containing accounts, or other groups and formulas - you can organise accounts into different groups of your choosing. Groups are indicated by the grey Group badge. The number of accounts, groups and formulas within a group is displayed below the group name.

Formulas are calculations performed on the group totals or results of other formulas. Formulas are indicated using the green Formula badge. The formula itself is displayed below the formula name.

Charts are report sections that display data from groups or formulas in bar or line chart format. Charts are indicated by the Chart icon.

Groups, Formulas and Charts can be arranged within the layout in any desired order - they can also be hidden, collapsed and styled to achieve the required report output. This section describes how to make changes to Groups, Formulas and Charts to meet your layout specification.
Quick Toolbar
You can quickly perform many of the actions described below using the Quick Toolbar. Simply hover your mouse over the Group, Formula or Chart to bring up the quick toolbar. Hover over each button to see what it does. In the section below, if an option is available through the Quick Toolbar it will be marked with QT.

Adding/Editing Groups
Groups are layout sections containing accounts. The accounts that appear within each group of a newly created layout are based on the accounts that are within the Chart of Accounts of all the Companies you have linked.
- The accounts will appear in the standard layout groups (Revenue, Expenses, Current Asset etc.) depending on the account mapping - see the Chart of Accounts section for more information on accounts mappings.
- The Balance Sheet and Cashflow reports have additional accounts (for Profit for the Year and Net Income respectively) which are added automatically by Joiin.
- In the same way as Joiin merges accounts with the same name/code on the main reports, accounts are merged in the edit screen too.
To add or edit groups:
- Click on the Add button next to the Layout name and select New Group button to add a new group
- Alternatively, to edit an existing group, click on the Group Name or select Edit from the three-dot menu on the group
- Make your changes to the group options - see below
- Click on Accept to make the changes or Cancel to abort the changes
- Click on the Save button to permanently save the changes
Options for editing groups
When editing a Group there are various options available. To show the group options, click on the group's name.
| Option | Description |
| Icon | Select an icon you wish to display next to the Group name on the report output. |
| Group Name | The name of the group that will appear when a report using this layout is run. |
Show Total | Select this option to control whether the totals for the group are shown when a report using this layout is run. [Available in Quick Toolbar] |
Collapse and Show Total | Select this option to control whether the individual accounts are shown when a report using this layout is run - this is helpful if you don't need to see individual account values but just the total. Note you can quickly expand or collapse a group by selecting the Collapse/Expand option from the three-dot menu. [Available in Quick Toolbar] |
| Hide Group | Select this option to hide the group entirely when a report using this layout is run. This can be helpful if you have some accounts which you want to include in a formula but do not want to display the accounts or total separately - or if you want to remove accounts entirely from a report. [Available in Quick Toolbar] NOTE: you can hide any hidden groups from the screen while editing by deselecting the Show Hidden Elements toggle. |
| Style as account | Select this option to change the styling of this Group on the report output. With this option selected the group will appear the same as a normal account. [Available in Quick Toolbar] |
| Page break before | Selection this option add a page break before this group when it appears within a Report Pack. |
| Available as KPI | Make this Group available as a KPI for use in Dashboard Widgets and Report Pack Charts. |
| This group contains | This controls how the results and totals are displayed for accounts in this group. You should set this to the correct setting depending on the type of accounts you will be placing within this group. Profit & Loss - Displays the values of the accounts in this group as on the P&L, i.e. the account balance movements from the start of the period to the end Balance Sheet - Displays the values of the accounts in this group as on the Balance Sheet, i.e. the account balances at the end of the period Cashflow Cash - Displays the values of the accounts in this group as on the Cash section of the Cashflow, i.e. the account balances at the start of the period Cashflow Activities - Displays the values of the accounts in this group as on the Activities section of the Cashflow, i.e. the account balance movements from the start of the period to the end, carries over from previous fiscal year NOTE: on Nested groups this setting is disabled and automatically set to the parent group setting |
Credit Positive | Debit Positive | Use this switch to control whether you want to show Debit Account (e.g. Expenses) balances as positive or Credit Account (e.g. Sales) balances as positive. This also controls how budget variance figures are shown - a Debit Positive group would show actual amounts over budget in Red and under budget in Green- the opposite applies for Credit Positive groups. |
| Budget Favourability | Control how budget variance figures are displayed on reports. Over budget - Display budget variance in GREEN if the actual value is over the budget value Under budget - Display budget variance in RED if the actual value is over the budget value Netural - show the budget variance in black, regardless of value |
Adding/Editing Formulas
Formulas are calculations that are performed when a report using this layout is run. Groups and other Formulas can be combined with operators (PLUS, MINUS etc.), KPIs and Temporals to create formulas.
- Click on the Add button next to the Layout name and select New Formula button to add a new formula
- Alternatively, to edit an existing formula, click on the Formula Name or select Edit from the three-dot menu on the formula
- Enter or change the name of the Formula in the Formula Name field
- Build your formula using the Formula Editor - for details on how to use the formula editor see this article.
- Click on Accept to make the changes or Cancel to abort the changes
- Click on the Save button to permanently save the changes
Types of Operand
When selecting operands for your formula you can choose from the following types (depending on the type of report).
| Type | Description | |
|---|---|---|
 | Group | A group from within the layout. |
 | Formula | Another formula within the layout. |
 | KPI | A built-in KPI. This is a convenient way to access common values without having to calculate them yourself. |
 | Non-Financial Data | An item of Non-Financial Data. |
 | Temporal | A built-in Temporal value which can be useful for certain types of formula. Currently there are two available temporals. Days in Period - This function calculates the number of days in each period on the report. Can be used for calculating a daily value such as daily revenue, or combined with Days in Year, an annualised value such as annualised revenue. Days in Year - This function calculates the number of days in the year for each period on the report. Can be used for calculating an annualised value such as annualised revenue. |
| Enter a value | This allows you to enter a fixed, numeric value into your formula - select this option and enter the required value. |
* Note you cannot select another Formula as an operand if it includes the formula you're editing as an operand - this prevents circular references from occurring
Options for editing formula
When editing a Formula there are various options available.
| Option | Description |
| Formula Name | The name of the formula that will appear when a report using this layout is run. |
Hide formula | Select this option to hide the formula result when a report using this layout is run. This can be used if you want to have intermediary formula (for use in more complicated calculations for example) that you do not wish to show the results for. [Available in Quick Toolbar] NOTE: you can hide any hidden formulas from the screen while editing by deselecting the Show Hidden Elements toggle. |
| Hide if zero | Select this option to hide the formula result if the results are zero. |
| Style as account | Select this option to change the styling of this Formula on the report output. When this option is selected the formula will show as a normal account row. [Available in Quick Toolbar] |
| Available as KPI | Make this Group available as a KPI for use in Dashboard Widgets and Report Pack Charts. |
Result formatting | Select the format you wish to show the formula result using. This can be either Numeric, Currency or Percentage. Numeric - results displayed as a number Currency - results displayed as currency Percentage* - results displayed as a percentage Ratio - results displayed as a ratio, e.g. 5x * NOTE when Percentage is selected, the Total Calculation Method setting is disabled. This is because, with Percentage formatting, the Total Calculation Method will always be Calculate. |
| Decimal places | If you have selected Number, Percentage or Ratio formatting you can also choose how many decimal places will be displayed. Choose 0, 1 or 2 or leave as the Default and the decimal places will follow what has been set for the Global hide decimal places setting. |
| Total Calculation Method | The method used for calculating the values in the Total column: Sum - sums up each column Start Balance - uses the start balance from the first column End - uses the end balance from the last column Average - takes an average of all the values in each column Calculate - calculates the the total using the total values from the formula operands See this section for more info |
| Budget Favourability | Control how budget variance figures are displayed on reports. Over budget - Display budget variance in GREEN if the actual value is over the budget value Under budget - Display budget variance in RED if the actual value is over the budget value Netural - show the budget variance in black, regardless of value |
Total Calculation Method Explained

Adding/Editing Charts
- Charts are always displayed at the top of a report.
- Charts will use the data based on the Report Filters set for the report that is being run - this is distinct from Report Pack charts which have their own report filters. You can have a combination of both on report pakcs.
- You can arrange charts so that they are in two columns or a single column.
- Click on the Add button next to the Layout name and select New Chart button to add a new chart
- Alternatively, to edit an existing chart, click on the Chart Name
- Enter or change the name of the Chart in the Chart Name field
- Select the Chart Type: Bar, Line or Donut.
- Select the Groups or Formulas you wish to include as the Chart series. Each group or formula you select will appear on the chart as a bar, line or donut segment.
- Click on Accept to make the changes or Cancel to abort the changes
- Click on the Save button to permanently save the changes
- To move a chart up or down, click on the up/down arrows to the top right of the chart
Options for editing charts
When editing a Chart there are various options available.
| Option | Description |
| Chart Name | The name of the chart that will appear when a report using this layout is run. |
| Hide Chart Name | Select this option to hide the name of the chart when a report using this layout is run. |
Collapse | Select this option to show the chart collapsed when a report using this layout is run - the chart can then be revealed by clicking on the title if required. [Available in Quick Toolbar] |
| Start at zero | Select this option to force the chart axes to start at zero. If this option is not selected the chart will automatically adjust the axes start point depending on the data. |
| Chart type | Select the type of chart: Bar, Donut or Line. |
| Chart series | Select each group or formula you wish to appear as a chart series. For Bar and Line chart, each series you select will appear as a separate bar or line on the chart in a different colour - the bars/lines will be repeated for each period/company/category selected in the report filters. For Donut charts, if you select only one series, the donut segments will be made up of each period/company/category selected in the report filters. If you select more than one series then the donut segments will represent each of those series using the total values for all the period/company/categories selected in the report filters. |
Moving and Nesting Groups
You can move groups, charts and formulas around in the layout so they appear where desired. You can also move groups or formulas to be nested within other groups.
- Click on the three-dot menu on the group, chart or formula you wish to move
- Select Move
- Select To, Above or Below
- Select the Group, Chart or Formula to move to/above/below
- Click on the Save button to save your changes
Alternatively use the Quick Toolbar to move groups, charts and formulas up and down within the layout.

Deleting a Group, Formula or Chart
To delete a group, formula or chart:
- Click on the three-dot menu on the group, chart or formula you wish to delete
- Select Delete
- Click the Delete button to confirm the deletion
- Click on the Save button to save your changes
NOTE Groups cannot be deleted if they have accounts in them or if they are referenced by formulas. Formulas cannot be deleted if they are referenced in other formulas.