IN THIS SECTION
- Overview
- Adding a Report to a Pack
- Saved Reports & Packs Page
- Viewing and Downloading Report Packs
- Building Report Packs
- Sharing Report Packs
- Copying Report Packs to another Client
- Fixing Report Pack Issues
Overview
Report Packs let you bring together multiple reports, charts and commentary into a single, professional document that’s easy to share and present. Whether you’re preparing board packs, monthly management reports or client updates, Report Packs help you:
Combine multiple reports into one document – mix financial reports, custom visuals and written analysis in a structured format.
Tailor content for different audiences – apply filters, layouts and commentary to suit different use cases or stakeholders.
Present live or export to PDF/Excel – choose full-screen mode for presentations or export packs to share as files.
Automate distribution – schedule report packs to be emailed weekly or monthly to your team, clients or board members.
Create branded, polished output – customise cover pages, themes and layouts to reflect your company’s branding.
Control structure and layout – use sections, rows and columns to build reports your way, with full control over formatting and flow.
Support compliance and reporting standards – structure your packs to meet requirements for GAAP, IFRS and other regulatory frameworks.
Are quick and lightweight when needed - quickly add a single report to a pack - all your filters and layout get saved with that report and you can run it whenever needed
With Report Packs, you can turn complex financial data into clear, well-structured insights — all in just a few clicks.
Adding a Report to a Pack
The best way to get started with Report Packs is to add a report to a pack. To do this simply run any report with the desired filters applied (e.g. Year to date, compare to Previous Period) and Layout selected then click on the Save Report button and select one of the three options.
- Save as Report - a new report pack will be created with a single report in it - no cover or contents page - this is a great option for saving a single report for quick access at any time and lets you save all the filter and settings options along with it. You can amend the report name when you select this option.
- Add to new report pack - a new report pack will be created with a Cover and Contents page and a single report - this can be further added to and enhanced as desired. You must enter a report pack name when you select this option.
- Add to existing report pack - the report will be added to the end of an existing report pack. You must select the existing report pack when you select this option.
Whichever option you select, after selecting/setting the report name, you will be given the option to set the dates as Dynamic.

See the Dynamic Dates section in the Building Report Packs article for more information on the Dynamic toggle.
Click on Save and the new report pack will be created and the report added to it.
You will be presented with the new report pack, with the report added to it within a Section.
From here you have quick, lightweight report that has all the selected filters and layout saved with it and can be run any time from the Report Packs menu.
Alternatively, once you've created a Report Pack you can build it out further by adding Sections, Rows, other Reports, Charts, Text Components etc. or you can add more reports in the same way, by running the report from the main menu first.
Report Packs, once created, will be private only to you - you can later Share a report pack to allow other users to view and edit it.
Other ways to create a Report Pack
Alternatively, you can create a report pack from scratch the Report Pack List page. Simply navigate to the Report Packs page from the left menu and click on the New Report Pack button. From there you have the following options:
- Example Report Pack - creates a new pack with common reports, charts and text pre-populated and laid out to help get your started.
- Empty - creates a completely empty report pack
- With Cover and Contents - creates an empty report pack but includes a cover and contents page
Select one of the options and the pack will be created. From there you can Add a Section and start to build your new Report Pack.
Renaming a Report Pack
Once you have created a Report Pack you can change the name by clicking on the name at the top right. You can then edit the name.
Saved Reports & Packs Page
The Saved Reports & Packs page is your central hub for managing all report packs. From here, you can:
View all report packs that were created by you or that are shared with you at a glance, with key details like last update time and report contents (e.g. number of tables and charts).
Create new packs using the + New Report Pack button.
Open existing packs to edit or review their contents.
Download reports as PDF or Excel using the download icon.
Create a copy of a Report Pack by selecting Clone from the three dot menu.
If using Multi-Client, copy a Report Pack to another Client by selecting Copy to client from the three dot menu.
Share packs with other users, teammates or external users via shareable link. See Sharing section for more info.
Send report pack PDFS via email or schedule automated sending. See Emailing PDFs section for more info.
Sort and filter your list to find specific packs quickly.
Set a favourite using the star icon for quick access to key reports.
This page makes it easy to keep your report packs organised, accessible, and ready to share.
Pinning Report Packs
You can make it so you can quickly access your most-used Report Packs by pinning them to the main menu. The pinned reports will appear in an expandable section off the main menu item.

To do this simply click on the star/favourite icon on the Saved Reports & Packs page to make the report pack a favourite. This marks it as favourite in the list but also pins it to the main menu.
Viewing and Downloading Report Packs
From the Saved Reports & Packs page you can click on a Report Pack to view it. By default the report will display in Builder mode, where you can modify the contents of the report by hovering over the sections to access the edit tools.
The pack is displayed in an intuitive visual way that represents how it would appear on the printed page (when you download to PDF - see below). You can select the paper size and orientation for your report pack sections (see Global Settings section below) and this will dictate how the components appear within the pack.
A note on Page Breaks
Each Section starts a new page which is represented on screen as with a page outline as below.

When a section contains content (such as reports, charts, text or images) that crosses a page break, Joiin displays a PB icon to indicate where the break occurs. Hover over the icon to reveal a visual line showing the exact page break position. Because it’s not always possible to automatically split elements like charts or reports cleanly, Joiin avoids making assumptions - cutting through the middle of a chart, for example, is rarely ideal. Instead, you can review the layout yourself and adjust the content as needed. This also ensures a smooth, uninterrupted flow when the pack is viewed online.

TIP: You can force a page break to occur at a particular point in a report using Layouts. Set the Page break before setting on a Group within your Layout to achieve this. See this section of the Layouts article for more info.
A note on columns
If your report contains a lot of columns, it is not easy to fit all those columns on a page in a presentable way. Joiin will fit as many columns as it can within the selected paper size and orientation (you can choose the paper size and orientation of each section - see below for more information). If there are too many columns to fit, when viewing online you can scroll from left to right to view the whole report.

If there are too many columns to fit a message will be displayed, suggesting that you can change the page settings. You can also click on Auto Resize and Joiin will adjust the page settings as best it can to fit the report.

If you do not adjust the settings, when downloaded to PDF, the report will be truncated (right-most columns removed).
A note on Expanding/Collapsing Groups
When viewing a report in a report pack you can expand or collapse groups - this makes the groups expand/collapse for viewing purposes but these changes are not saved and it does not change how the downloaded PDF will appear. You can change the Layout of any report if you wish to change the way groups are expanded or collapsed permanently.
Scrolling
You can scroll to the bottom or top of a Report Pack by clicking on the up and down arrows at the bottom right.

Presentation Mode
Click on the Present button to view the report in Read Only, Full Screen mode. This is useful if you are presenting the pack to an audience online or on a big screen.
Downloading a Report Pack
You can download a Report Pack to PDF or Excel by clicking on the download icon to the top right of the pack in Builder mode. Alternatively by clicking on the download icon next to the pack in the Saved Reports & Packs page.
Select the desired output format: PDF or Excel.
Your Excel file will be downloaded - the Excel file contains a separate worksheet (tab) for each report within the Report Pack.
NOTE: the Excel download contains a separate worksheet (tab) for each Report within the Report Pack. Currently any charts, images or text you have in your report packs will not appear in the Excel version.
Building Report Packs
See the Building Report Packs article for details on how to build a report pack.
Sharing Report Packs
Once you have created a Report Pack you can share it with other users for them to view and, optionally, edit it. There are several ways you can share a report pack.
- Share with other Joiin Users or Teammates. They will be able to view and edit the Report Pack directly in Joiin, the same as you.
- Share a shareable link to external people. A secure link is sent via email to the person and they can view a read-only version of the report pack.
- Email PDFs to internal users or external people. Emails can be scheduled to send on a periodic basis or sent as and when required.
This section outlines these options in more detail.
Sharing with other users and shareable links
Once you have created a Report Pack you can share it with other users so that they can view or edit it. To do this, click on the Share button next to the pack on the Report Pack list page, or from within the Report Pack itself.
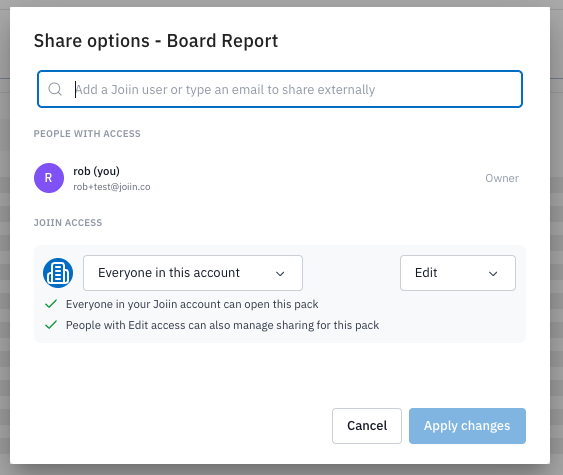
This opens the Share options dialogue. In here you can choose users to share the pack with or choose to share it with everyone on the account.
Sharing with individual users
At the top, a list of people currently with access will be shown - if you have not shared before this will only include you, as the owner. You can search for users by typing in the box at the top. A list of all Joiin users, teammates and previously added external users will be displayed.
NOTE: Who you can share with depends on your Joiin user role. See the user management roles article for more information.
Select one to add to the list of people with access - the user will be added and you can then select from the dropdown to the right whether they have View or Edit access. You can also remove the access from this dropdown by select Remove.
Sharing with external users
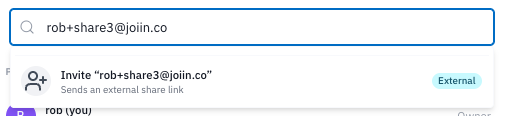
You can share a secure link to view the report pack to an external person via email. To do this enter the email address in the box - if they have been previously added as an external user (by you or someone else) there email will appear in the list, marked as External, and you can just select them - if they have not been previously added you will have the option to invite them for the first time.
Once you choose to invite them for the first time they will appear in the list with a status of Invite pending.
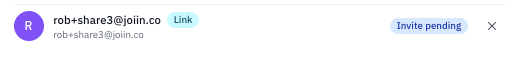
They will receive an email and once they have clicked on the link there their name will show with the expiry date of the link. For security purposes, all links have a validity period of 1 month from the time of sending.
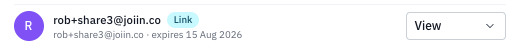
You can select Resend Link from the dropdown to the right to resend the link via email which will also reset the expiry date. You can also choose to remove access, i.e. invalidate the link immediately, by selecting Revoke access from the dropdown.
Verify access code
As the security of your financial data is critical, Joiin adds another layer of security on the recipient end. When they click on the link in the email, before accessing the report, they must receive a code to their inbox and then enter that code into the Verify screen.
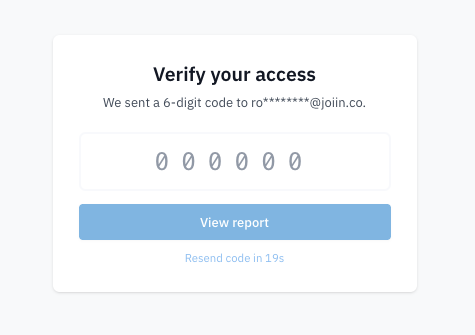
This ensures that any links that get shared to someone they shouldn't cannot be accessed - only the user who has access to the specific email address is able to access the report.
Once done, click on Apply Changes to share the pack.
NOTE: Shared report pack links can be interacted with - e.g. as mouse moves over a chart additional information about the chart is displayed - but it is not possible to drilldown from the reports into additional transactional data.
Sharing with everyone in the account
As well as sharing to individual users and external users you can also set a report pack so it is automatically accessible to all the users in your Joiin account.
In the bottom, Joiin Access, section you can choose from two options.
Restricted - only you and any users you have specified in the top section will have access.
Everyone in this account - all Joiin users (for that client - i.e. all users in the User Management screen) will have access - you can additionally set whether they have View or Edit access
Emailing PDFs or Excel files
You can download a PDF or Excel of a Report Pack any time directly from the report pack. But you can also automate the sending of PDFs/Excels via email or send an email immediately directly from within Joiin. Emails will be sent to the selected user with a PDF and/or Excel version of the Report Pack attached and can be sent to recipients from your list of users or to any external email address.
Sending an Email Now
You can email a Report Pack to users at any time, by selecting the Send email now option.
- Select Saved Reports & Packs from the left menu.
- Click on the Share button to the right of the Report Pack to be emailed and select Send email now .
- Alternatively click on the Share button at the top right while viewing a report pack.
- This opens a popup

- Select the recipients. Click in the To: box to bring up a list of system users - select the users you wish to send to.
- You can add additional emails, for people who are not part of the team by clicking on the Add external user link. External users you add here will be saved to the recipient list so they can be selected when you share report pa
- You can invite new users to Joiin by clicking on the Invite New user to join link - this will take you to the User Management page
- Enter the subject line. OPTIONAL - a default value will be used but you can amend to use your own subject line if required.
- Enter the text you wish to enter in the email message. A default text will be supplied initially and you can edit from there. You can edit text using the Joiin AI Text Editor which gives you control how the email is formatted and helps you write.
- You can also select template variables which will replace the text with the real value, such as report pack name or subscription name, when it is sent.
- Click on the Preview button to see how your email will look when it's sent.
- Select the format: PDF and/or Excel.
- Click the Send Now button.
- Emails will be sent to the selected recipients, with the Report Pack attached.
Scheduling Emails
- Select Saved Reports & Packs from the left menu.
- Click on the Share button next to the Report Pack you wish to schedule.
- Alternatively click on the Share button at the top right while viewing a report pack.

- Select the Create Schedule option.
- Select the recipients, write the email text and other options as in the Send Email Now section above.
- You can then set the schedule the emails will be sent in the section below.

- Select the frequency and schedule, Weekly or Monthly
- If Weekly selected, select the days of the week you wish the report pack to be emailed
- If Monthly selected, select the day of the month you wish the report pack to be emailed
- In the Upcoming section you will see the next three dates the emails will be sent
- Click on Schedule button to schedule the emails.
- The Schedule icon will turn blue to indicate the report pack has been scheduled.

Editing a Schedule
You can edit a schedule by clicking on the blue Shared button selecting the Schedule Active option.
Cancel a Schedule
You can cancel a schedule so that no more emails are sent for a Report Pack by clicking on the blue Shared button and selecting the Cancel Schedule option.
Unsubscribing
Any user who receives a report pack email can unsubscribe at any time by clicking on the unsubscribe link in the email. If they do this they will be removed from the list of users in the report pack schedule.
Issues with Sending
If a scheduled report pack has a configuration issue it may not be possible to send it via email. In this instance you will see a message next to the report pack in the list. You can attempt to send the report by clicking on the

Copying Report Packs to another Client
For accounts with Multi-Client enabled you can copy Report Packs from one Client to another. For example if you have created a Report Pack for one of your clients - you can quickly copy the structure and layout so it can be used by another of your clients.
To copy a report pack to another client go to the Report Pack lists page and select Copy to client from the three-dot menu next to the report pack you wish to copy. This will start a step-by-step process where you select options to control how the report pack is copied.
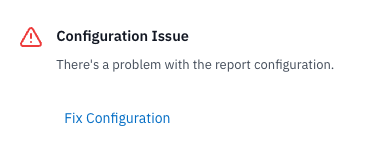
If any of the mappings are not completed or there are other mismatches between the source and destination (e.g. mapped companies have different data start dates, causing reporting dates to be invalid) a Configuration Issue will be displayed on the copied report pack - this can then be easily fixed by setting the correct properties on the report or chart.
Mapping Steps
Because the source and destination clients may differ entirely in the companies they contain and other configuration details such as Eliminations and Categories, a series of mapping steps must be completed so Joiin knows how to copy the report pack. The number of steps will depend on the structure and content of the report pack being copied.
Select Client
Select the destination client from the dropdown and enter a name for the report pack. Click Next to proceed to the next step.
Map Companies
On this step you can map the Companies on your destination client to the Companies on the Report Pack. As another client may have entirely different Companies, Joiin needs to know how to treat the companies that have been configured on each report and chart within the Report Pack.
By default the Use one set of companies for every report toggle is off - you will be presented with a list of all companies that are used on a report pack - and an option to select the destination company you wish to map to each. Joiin will attempt to match similarly named companies.
Alternatively, setting the Use one set of companies for every report toggle to on, allows you select one set of companies that you wish to apply to all reports and charts on the report pack.
Make your selections and click Next to proceed to the next step.
Map Company Groups
As with Companies in the previous step you can also select the destination Groups to use on the Report Pack.
Select a destination group to map to each company group on the report pack and click Next to proceed to the next step.
Set Currency
Choose to keep the same currency on every report/chart within the pack or switch the toggle on to select a different currency to use across the whole report pack.
Click Next to proceed to the next step.
Map Eliminations
If you have Elimination Sets applied to any of the reports or charts on the report pack, you can map the source Elimination Sets to the destination Elimination Sets on this step. Select the destination Elimination Set to map to each source Elimination set and click Next to proceed to the next step.
Map Budgets
If you are using Budgets data on any of your components on the report pack, you can map the source Budget to the destination Budget on this step. Select the destination Budgets to map to each source Budget and click Next to proceed to the next step.
Map Categories
You can map the Categories used on the report pack to destination Categories on this step.
Click Next to proceed to the next step.
Layouts
If you are using custom layouts on any of your reports on the report pack, you can choose to copy those layouts to the client along with the report pack. This is the same as manually copying the layout to a client that can be done from the Layouts List page.
The copy layouts toggle will be enabled by default and the list of layouts being used on the report pack will be displayed.
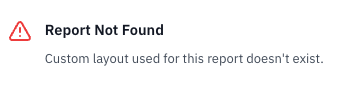
You can disable the toggle to prevent any layouts from being copied. If you do this the copied report pack will show an error as below - you can then select the layout you require.
Review
On the final step you can review all the settings you have made. You can click Back to make any changes. If you are happy click the Copy report pack button to proceed - a new report pack will be created on the destination Client.
Fixing Report Pack Issues
Sometimes, if you remove Companies or Groups from your account or change the Company import dates, previously created Report Packs can become invalid. If this happens a message will be displayed against the pack in the Report Pack list page:

Click on the pack to edit it and you will see an additional message against each component that has a problem.

Issues can be easily fixed by clicking on the Fix Configuration link - this will open the report parameter settings and highlight what is invalid where appropriate, e.g.

The parameters that have changed and/or need to be addressed will be highlighted with their previous values noted if appropriate. Fix any issues and click on the Save when done.