IN THIS SECTION
- Overview
- How a 3-way forecast works
- Viewing Forecasts
- Creating a Forecast
- The Main Forecast View
- Rules
- Payment Patterns
- Viewing Forecast on Main Joiin Reports
Overview
Joiin's Forecasting module lets you build a forward-looking projection of your finances directly in Joiin, generated from your own actuals using configurable rules and/or AI - rather than entering every number by hand.
Difference between Forecasts and Budgets
A budget is made up of figures you enter manually - pulled in from Xero or QuickBooks, or typed into Joiin yourself. Figures are entered against a flat list of accounts, across the whole chart of accounts. You can then report on the Budget data, alongside actual data, using the Budget toggle on any of the Joiin financial reports.
A forecast generates its figures automatically from your recent actuals using rules, patterns and/or AI - with figures entered manually on top if necessary. A forecast spans all three financial statements at once and you can view these three all in one place within the forecast itself. You can also report on the Forecast data, alongside actual data, using the Budget toggle on any of the Joiin financial reports, in the same way as Budgets.
You forecast your Profit & Loss, and Joiin derives the Balance Sheet and Cashflow from it - a 3-way forecast, where the three stay linked so any change flows through to your projected cash position.
The Balance Sheet is derived for you, but you can lay payment patterns over the top to refine it — for example, collecting revenue a month or two after it's invoiced - which controls when cash actually lands.
NOTE: This is an indirect, month-by-month forecast for medium-term planning (typically 12–24 months), not a daily or weekly invoice-level cash projection.
How a 3-way forecast works
A 3-way forecast links your Profit & Loss, Balance Sheet and Cashflow into a single connected projection. Business owners, accountants and CFOs use one to see where the business is heading — whether there's enough cash to cover an investment or a quiet period, how profit translates into actual cash, and what happens to the numbers under different assumptions. It's a core tool for planning, raising finance, and presenting to boards, investors and lenders.
A forecast is built in three linked steps.
1. Profit & Loss. Forecast values are generated for your revenue and expense accounts using rules — for example, a trend fitted to recent actuals, a fixed growth rate, or AI. This is the only statement you edit directly.
2. Balance Sheet. Derived automatically from the forecast P&L plus a few assumptions: which accounts represent your cash, receivables and payables, how earnings roll into equity, and how depreciation is handled. You don't type values into the Balance Sheet — you influence it through account mappings and payment patterns.
3. Cashflow. Generated from the P&L and Balance Sheet movements, exactly as Joiin produces your Indirect Cashflow report today.
The key idea: you only ever edit the P&L. The Balance Sheet and Cashflow are calculated from it, so the three statements always stay consistent with each other.
Viewing Forecasts
You can view a list of forecasts by selecting Forecasts from the left menu. The Forecast page shows all forecasts you have created. You can search, filter, sort and perform actions on forecasts from this page.
Filtering
The top section of the page contains a number of filters which allow you to narrow down the results.
| Filter | Description |
|---|---|
| Companies | Select the companies you wish to display forecasts for. Selecting a company will filter the results to only show Forecasts associated to the selected Companies. |
| Search by text | Enter text to search for a forecast with a name containing that text |
| Status | Enable or Disabled. |
| Currency | The currency of the forecast. |
| Start year | The year the forecast starts in. |
Clearing Filters
Click on the Clear Filters icon at the top to reset all filters, columns and sort order to their default settings.
Column Sorting and Ordering
Sorting
You can click on the column heading to sort the results by that criteria. The initial click will sort ascending and an up arrow will be displayed in the column heading, e.g.

Click again to sort descending - the direction of the arrow will change:

Selecting Columns
You can choose which columns to display when viewing results. To do this
- Click on the cog icon at the top right
- Check/Uncheck the columns you wish to see/hide
- Click on Apply button to apply the changes
Changing Column Order
You can change the order in which columns are displayed when viewing results. To do this
- Click on the cog icon at the top right
- Click and hold the three-bar icon at the left of the column name and drag/drop it into the place required.
- Click on Apply button to apply the changes
Resetting to Default
You can reset the columns and sorting to the default values. To do this
- Click on the cog icon at the top right
- Click on the Reset button
NOTE: Any changes you make to the filter, columns and sort order will be saved in your browser for the next time you visit the page.
Enabling/Disabling Forecasts
You can control which forecasts are used when running reports by enabling or disabling them. This can be helpful if you have numerous forecasts covering different scenarios.
To enable or disable a forecast simply click on the toggle to the left of the forecast.

Bulk Enable/Disable
You can enable or disable multiple forecasts in one go by clicking on the Status column heading and selecting Enable all or Disable all. This will act on only the forecasts that are being displayed based on the selected filters - so this is helpful when used in tandem with the filtering capabilities

Creating a Forecast
To create a Forecast click on the Add Joiin forecast button on the Forecasts list page. There are three steps to creating a Forecast.
Step 1 - General Settings
Enter the basic properties that define the Forecast as follows.
| Setting | Description |
|---|---|
| Forecast name | A name to identify the forecast. |
| Company group / Single company | Whether the forecast is based on a single company or a group. This determines which actuals are used. |
| Company | The company (or group) to forecast. |
| Currency | The base currency of the Forecast. |
| Time period | Choose Start + duration (pick a start month/year and a duration, e.g. 12 months) or Exact start & end dates. |
| Forecast duration | Number of months to Forecast - up to 60 months. |
| Elimination Set | Optional. The elimination set to apply - accounts will be eliminated and/or actual account balances adjusted based on the Eliminations within the selected set. |
Step 2 - Rules
Choose how forecast values are initially generated. The rules set here apply across all P&L account types - you can further refine these rules by account, account type and category from the main forecast page.
NOTE: Depreciation & Amortisation accounts don't use these rules — they will have a special rule applied where they are held flat at their most recent level, because depreciation follows a schedule rather than a trend. You can change this per-account rule after creating the forecast.
You can choose from four options - an image at the bottom gives a pictorial view of how the rule will effect the forecast values. For more information on Rules, see the Rules section below.
Start with a blank forecast
No rules are added to the forecast. All forecast values are zero.
Start with a default linear regression rule
A linear best-fit trend line is fitted to the past actual values and extended forward. You can choose how many months worth of past actuals the trend line is fitted to, defaults to 12.
Start with a default growth rule
Set a percentage Growth Rule - which will set the forecast value for each month, a certain percentage higher than a previous month. You set the Growth Rate (percentage), which defaults to 1%, and the Lookback period, which defaults to 12 months, to define how it behaves. e.g. with percentage set to 1 and Lookback period set to 12, each month, the forecast value will be 1% higher than the same month in the previous year.
Configure with AI
You can describe your forecast rules in words and Joiin AI will interpret this and create the Forecast rules based on this.
Step 3 - Accounts
Set the account mappings that Joiin uses to generate the forecast. Joiin auto-detects the key Balance Sheet accounts from your chart of accounts. Adjust any if needed — you can also change them later in Edit Forecast.
| Setting | Description |
|---|---|
| Cash | The bank/cash account your forecast cash balance flows through. Net Profit from the Forecast P&L will flow into this account - adjustments made for any Depreciation and Payment Patterns. |
| Accounts Receivable | Where forecast revenue sits before it's collected. Opening balance collection options and Payment Patterns will effect this. |
| Accounts Payable | Where forecast costs sit before they're paid. Opening balance collection options and Payment Patterns will effect this. |
| Collect/pay opening AR & AP over (months) | How many months to spread collection/payment of your opening receivables and payables over. The opening balance is the balance at the last Actual month - this balance is accounted for in the Forecast by being moved from AR/AP into Cash - how many months this movement occurs over can be configured with this setting. |
| Retained Earnings | The account prior-year earnings roll into. |
| Current Year Earnings | The account current-year profit accumulates in. |
| Accumulated depreciation / fixed asset | The account depreciation is written down against. Non-cash items (Depreciation & Amortisation) are written down against this account instead of reducing cash. All depreciation accounts write down to this one account - separate accumulated-depreciation accounts per asset class aren't modelled yet. |
Once completed, click the Create Forecast button to create the Forecast - you will be presented with the Main Forecast Screen.
The Main Forecast View
When a forecast is created (or when you open one to edit) you land on the Edit Forecast page. This is where you view and refine your forecast.
Tabs
The forecast is shown across three tabs — Profit & Loss, Balance Sheet and Cashflow — each in standard report layout (layout can be changed - see below). Months run across the columns; account lines are grouped by category (Revenue, Cost of Sales, Expenses, and so on) down the rows.
With this 3-tab view you can quickly see how your Forecast affects the numbers - what your Net Profit is on the P&L, how your Cash balance, asset and liabilities look on your Balance Sheet, and how the month-to-month Cash in-and-out appears on the Cashflow.
Actuals vs forecast
Months up to your last complete actual month are labelled Actual and can't be edited. Forecast months follow on from there. The header shows when actual values were last fetched, with a refresh control to pull the latest actuals through.
Editing the main properties
You can edit the main properties of the forecast by clicking on the three-dot menu at the top right and selecting Edit - alternatively click on the Edit icon which appears when you hover over the Forecast name at the top left.
The properties that can be edited include those that are set during the Creation process - see above. In addition, the following properties can be edited.
| Setting | Description |
|---|---|
| P&L Layout | The layout used for the P&L tab. Select from the available Custom Layouts you have created in your Joiin account. This enables you to tailor the forecast view for your needs. |
| Balance Sheet Layout | The layout used for the Balance Sheet tab. Select from the available Custom Layouts you have created in your Joiin account. This enables you to tailor the forecast view for your needs. |
Viewing and Editing Rules and Values
You can view and change the Rules and forecast values directly through the Profit & Loss tab on the Main Forecast screen. There are various ways to do this.
Default Rules
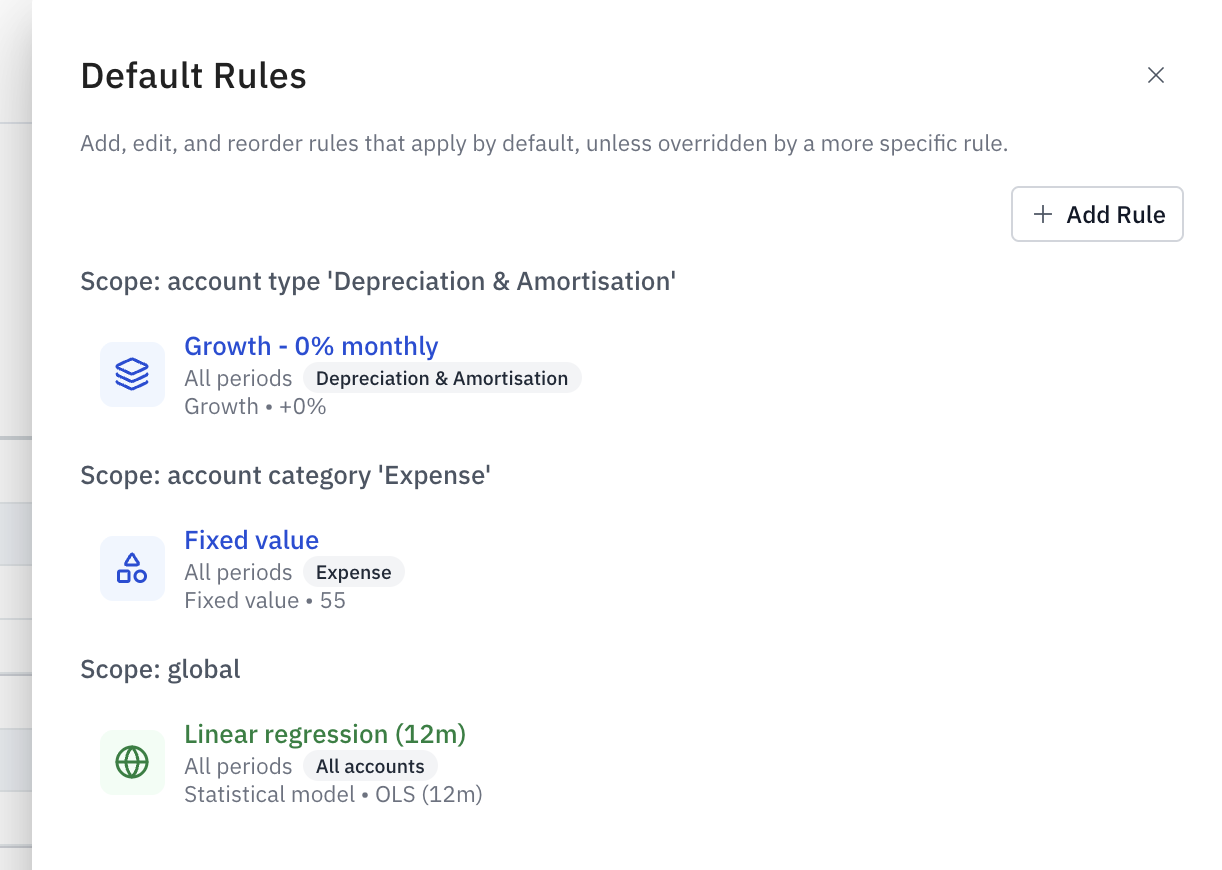
Click on the three-bar Default Rules icon at the top right to see details of all the Forecast rules that are scoped at the Global, Category or Account Type level. Account and individual cell level rules are not shown here - see below.
Each rule is shown, in priority order, with the details of the rule and its scope. See Rules section below for more detail.
You can edit a rule by clicking on the edit icon next to the rule - see below for more information on editing rules.
You can add a new rule by clicking on the Add button.
You can change the priority of a rule, that is within the allowable scope, by clicking on the drag handle next to a rule and dragging it up and down into the position you require.
You can delete a rule by clicking on the delete icon next to the rule.
After making any changes to rules, click on the Apply button to re-generate the forecast.
Account Name
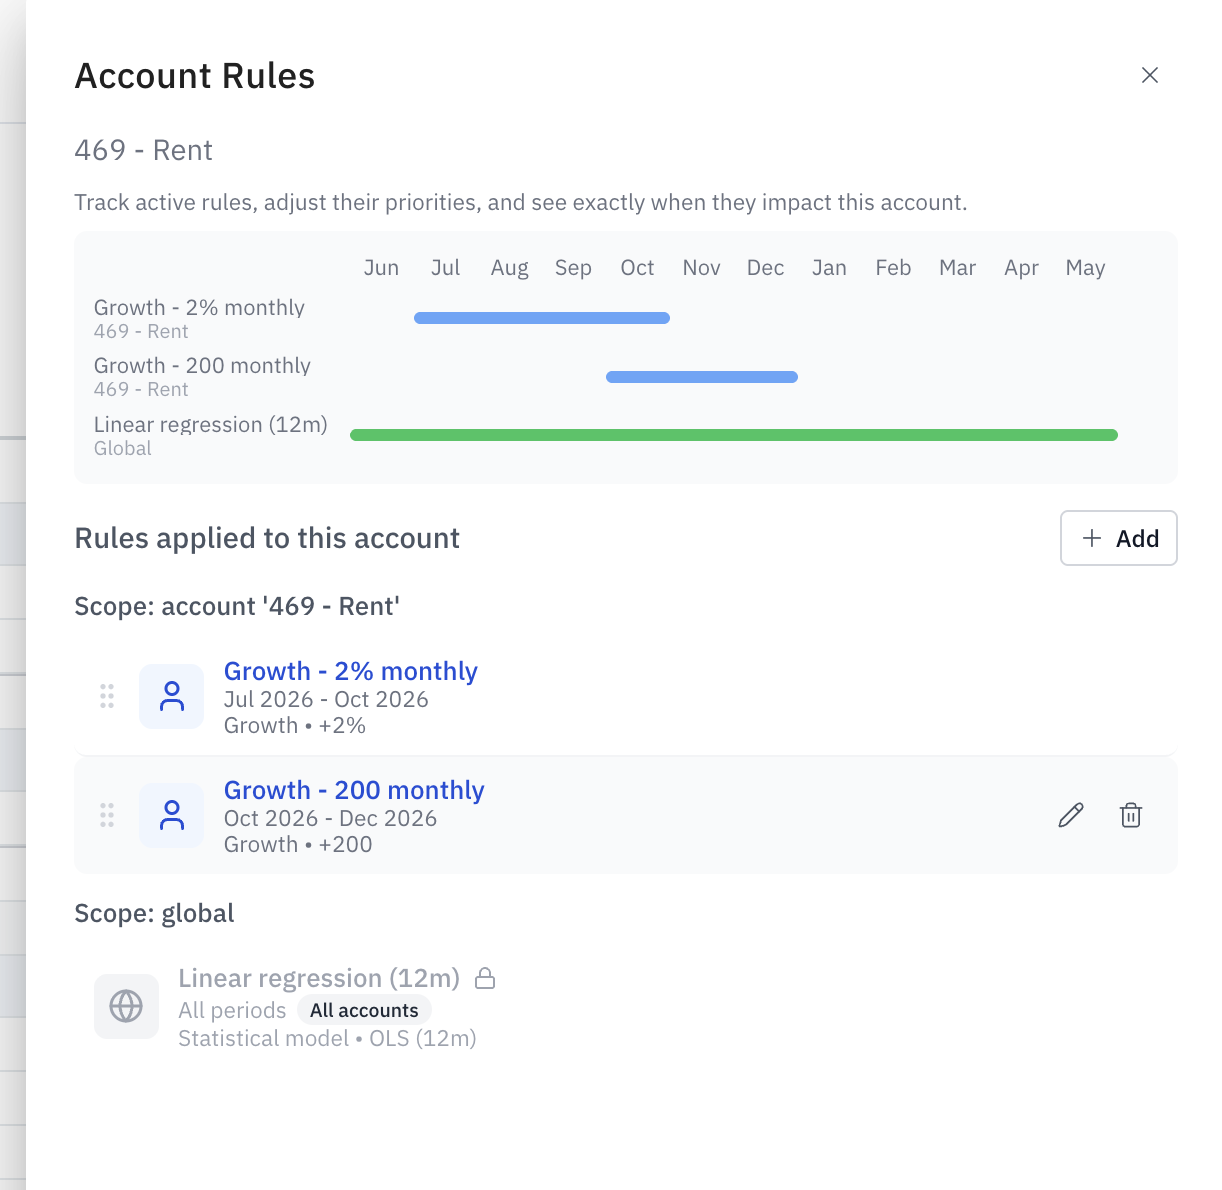
Click on an Account Name on the left hand side to bring up a side panel which shows the details of that account and the rules that apply to it across the whole forecast.
At the top, the name of the Account and a pictorial representation of how the rules apply will be displayed. In the bottom section a list of each rule that applies to this account will be displayed, in priority order - showing the details of the rule and its scope. See Rules section below for more detail.
You can edit a rule by clicking on the edit icon next to the rule - see below for more information on editing rules.
You can add a new rule by clicking on the Add button.
You can change the priority of a rule, that is within the allowable scope, by clicking on the drag handle next to a rule and dragging it up and down into the position you require.
You can delete a rule by clicking on the delete icon next to the rule.
After making any changes to rules, click on the Apply button to re-generate the forecast.
Individual Cells
You can edit the rules or values of an individual cell (specific account + month) in several ways.
Cell Detail
Right-click over the cell and click Cell Detail to view the details of the rules that apply to that cell and how the values are calculated. The rules applied will be shown in priority order and the amounts generated from each rule shown so that you can see how the final value is derived.
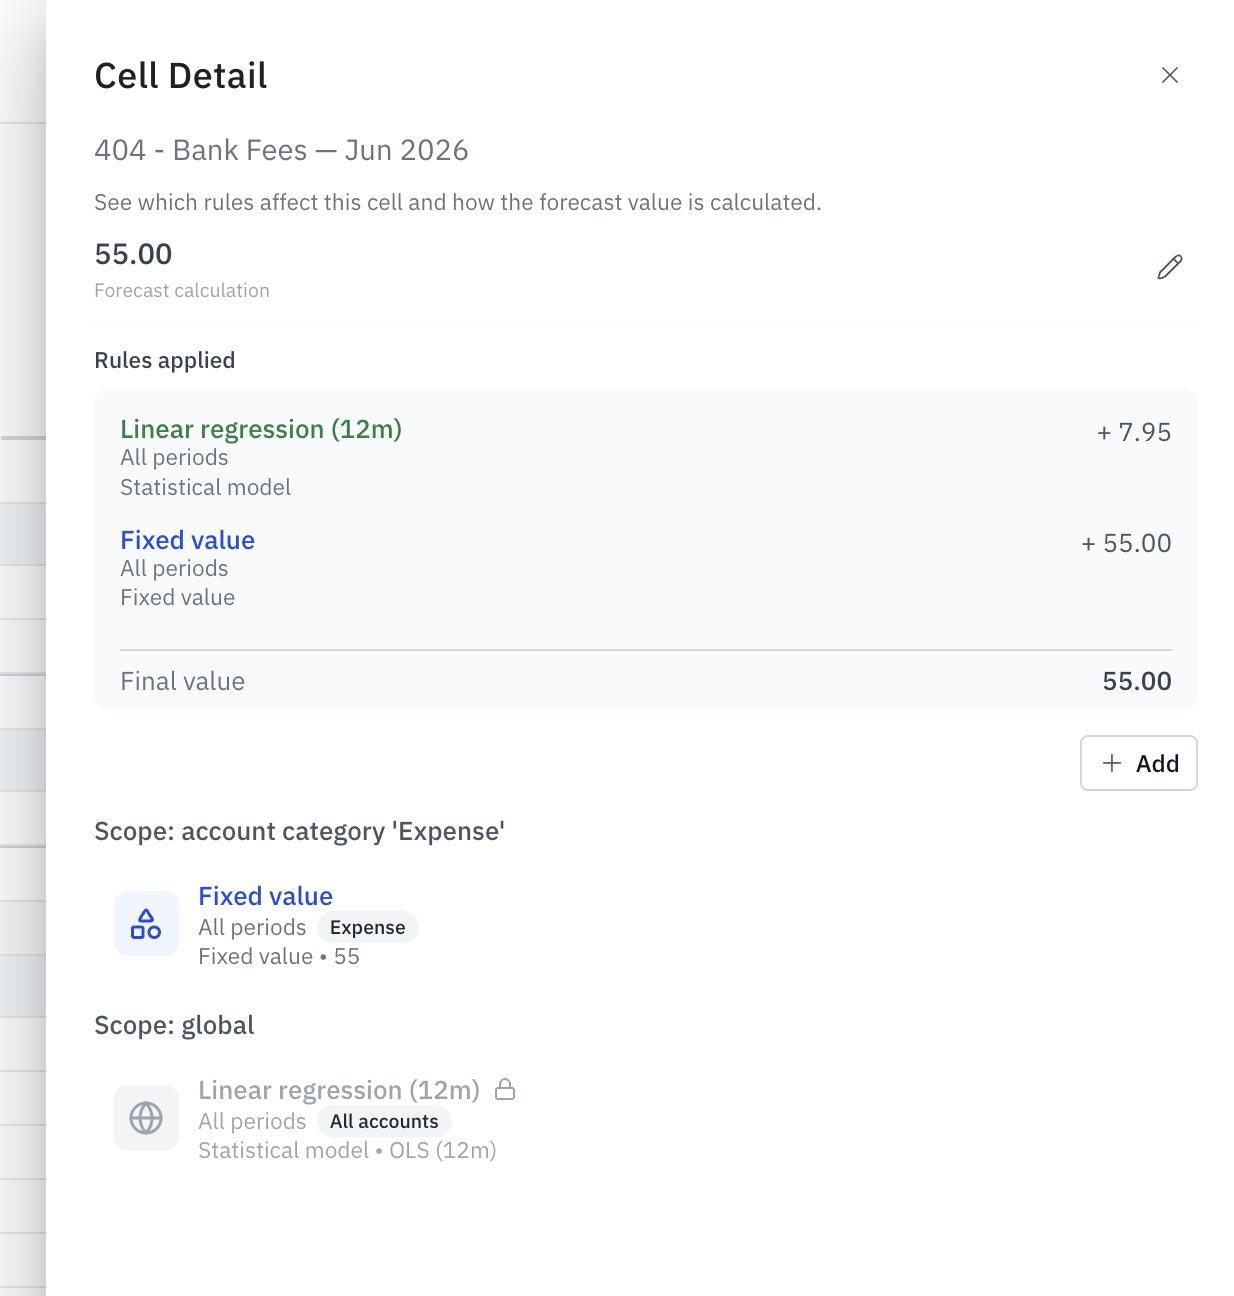
As with Account Name and Default Rules you can add, edit, delete and re-prioritise rules from within this section. You can also directly edit the cell value by clicking on the edit icon next to the main value at the top.
In-Line Editing
You can also edit values directly in the cell by double-clicking on a cell - this will open up that cell and row for editing - enter the values required and tab across to other cells to enter other values - once done hit Return or click on the check icon at the right to save the values and re-generate the forecast.

Cell - Add Rule
You can add a rule directly to a cell by right-clicking on the cell and selecting Add Rule - then select the type of Rule you would like.
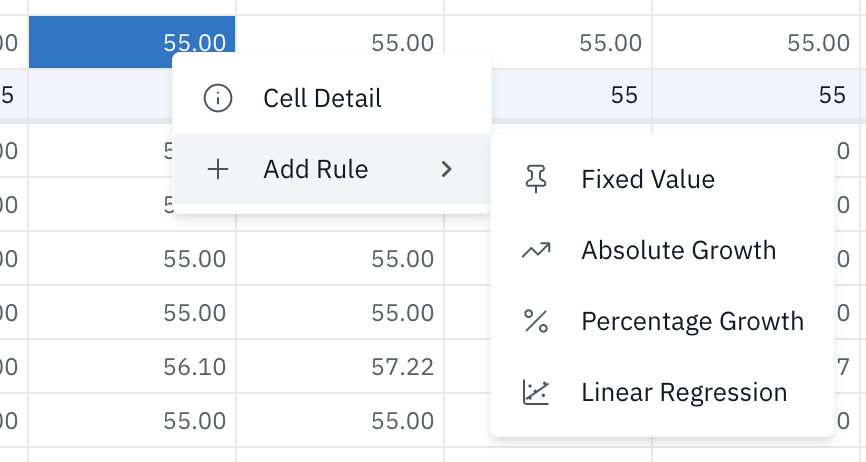
This will bring up the rule edit pane, with the Account, Dates and Rule Types pre-selected - from there set the remaining values and click on Add to add the rule. The forecast will be re-generated.
TIP: It may be quicker to add rules using this method - as dates are pre-populated - you can add a rule on one cell then adjust the dates in the rule edit pane to make it apply across multiple months.
Add Rule
You can also add a rule by clicking on the Add Rule (plus) icon at the top right. You can specify any rules details you require and the rule will be applied and forecast re-generated when you click the Add button.
Adding and Editing Payment Patterns
You can add or edit Payment Patterns by clicking on the Payment Patterns icon at the top right. This brings up a list of all Payment Patterns on the forecast. See Payment Pattern section below for more information.
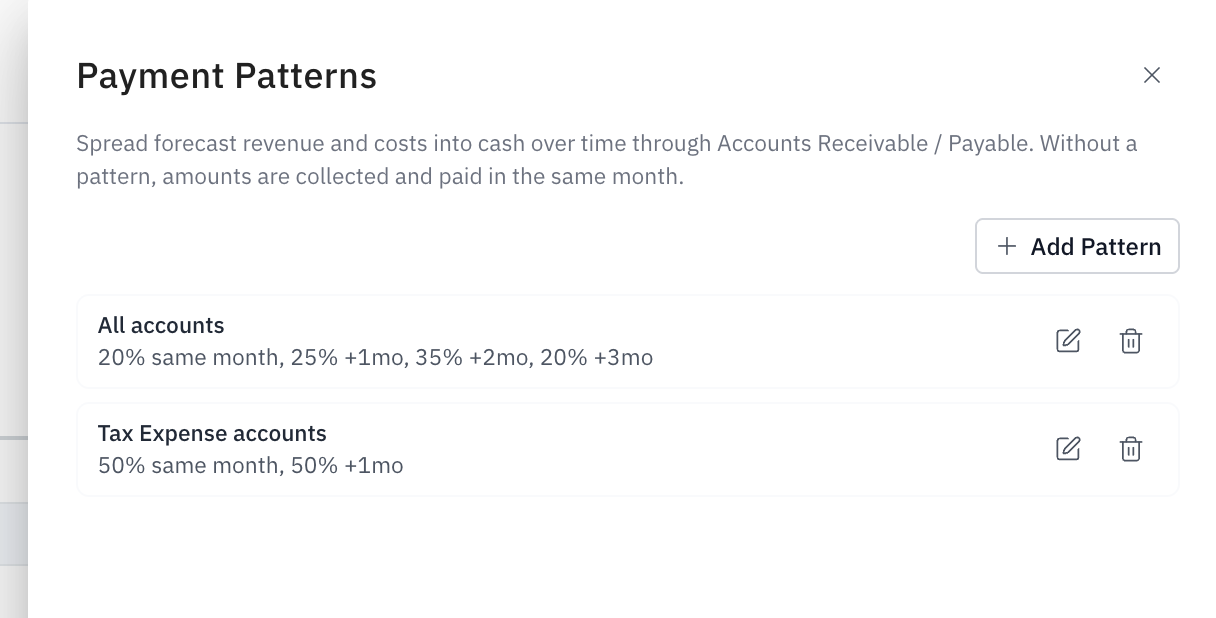
From here you can add a new Payment Pattern by clicking on the Add Pattern button.
You can edit an existing pattern by clicking on the Edit icon next to the pattern.
You can delete a payment pattern by clicking on the Delete icon next to the pattern.
Click on the Apply button to apply the changes and re-generate the forecast.
Note: If several payment patterns could apply to the same account, only the most specific one is used — a specific account beats an account type or category, which beats "all accounts" (ties broken by priority). Patterns apply only within their date range.
Filters
You can control how many months worth of actuals you see on the Forecast page by clicking on the Filters icon at the top right and selecting the number of months.
Saving the Forecast
After making any changes to the forecast (rules, values, patterns), to persist that Forecast permanently you must click on the Save Forecast button at the bottom right.
Balance Sheet Cell Info
On the Balance Sheet tab, you cannot edit any values directly but you can see how values are derived by clicking on the individual cells. A pane will open up on the left, showing how that number is derived - what payment patterns may have affected etc.
Refreshing Actuals
When a forecast is generated it bases the forecast numbers on Actual account balances from past months. These actual values are pulled at the time the forecast is generated. In order to prevent forecasts changing unexpectedly, due to actuals changing, the original actuals used for the forecast are retained and a message is displayed showing when the actuals were last fetched.
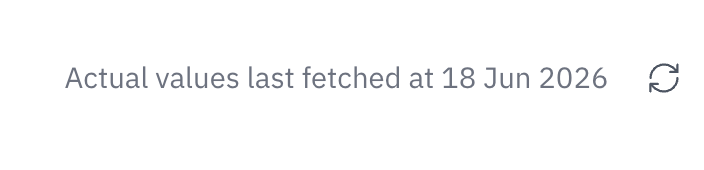
You can click on the Sync icon to re-fetch the actuals and re-generate the forecast from the actuals. When you do this you have two options.
- Overwrite the existing forecast with the new actual and forecast values.
- Save the forecast as a new forecast.
Rules
A rule tells Joiin how to generate the forecast value for a P&L account in a given month. Every forecast month gets its value from a rule - whether that's the default rule you chose when creating the forecast, or a more specific one you've added since.
You can add a rule by clicking on the Add Rule button at the top right of the Forecast - or by clicking on Add Rule when you are viewing rules at the account or cell detail level.

Rule types
There are three types of Rules that can be applied:
| Rule Type | Description |
|---|---|
| Fixed Value | Sets a fixed amount for each month. Value - the amount to change by |
| Growth | Sets each forecast month a set amount or percentage above a previous month. You set the growth rate and the lookback period (e.g. 1% above the same month last year). Growth Type - Absolute or Percentage Lookback Period - the number of months to lookback for the starting value Value - the amount or percent to change by |
| Regression | Fits a best-fit trend line to a number of months of past actuals and extends it forward. You set how many months of actuals the line is fitted to. Regression Type - Linear is only supported currently Regression window size - the number of historical months used for regression |
Rule Scope
A rule applies at one of several scopes, from broadest to most specific:
- Global — every account
- Category — Revenue, Cost of Sales or Expenses
- Account Type — a group of accounts of the same type, e.g. Fixed Expense
- Account — a single account
- Cell — a single account in a single month
You select the Scope when adding a Rule from the selection at the top - then select the specific item for that scope, e.g. a specific Account or specific Category. If you are adding a rule from viewing an Account or Cell Detail, the scope will be pre-selected.
Where more than one rule could apply to a cell, the most specific scope wins - a cell-level rule beats an account rule, which beats an account type, then category, then global.
Rule Priority
Where two rules sit at the same scope, the priority order decides. When viewing rules you can drag & drop them up and down, within each scope section, to re-prioritise them. You can also set the Priority to a specific number when you add the rule.
Date Range
You can also set the Date Range a rule applies to - select the Month/Year Start and Month/Year End to set the date range for the rule. That rule will then only be applied for that particular period. For example you can override the default regression rule for the summer months and make the values fixed.
Payment Patterns
More information on Payment Patterns coming soon.
Viewing Forecast on Main Joiin Reports
See this article for more information.