Custom KPIs let you track the figures that matter to your business, like revenue per site or payroll as a percentage of turnover. Set the calculation up once and use it in reports, charts and dashboards.
You can create a custom KPI in two ways. Build one from a formula, or reuse a section from one of your existing layouts. Both start in the KPI Library.

Creating a formula KPI
1. Go to KPI Library in the left sidebar
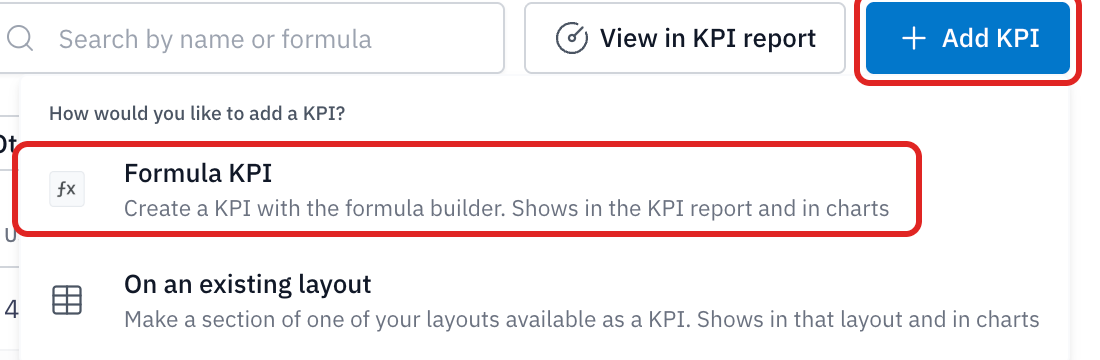
2. Select Add KPI in the top right, then choose Formula KPI
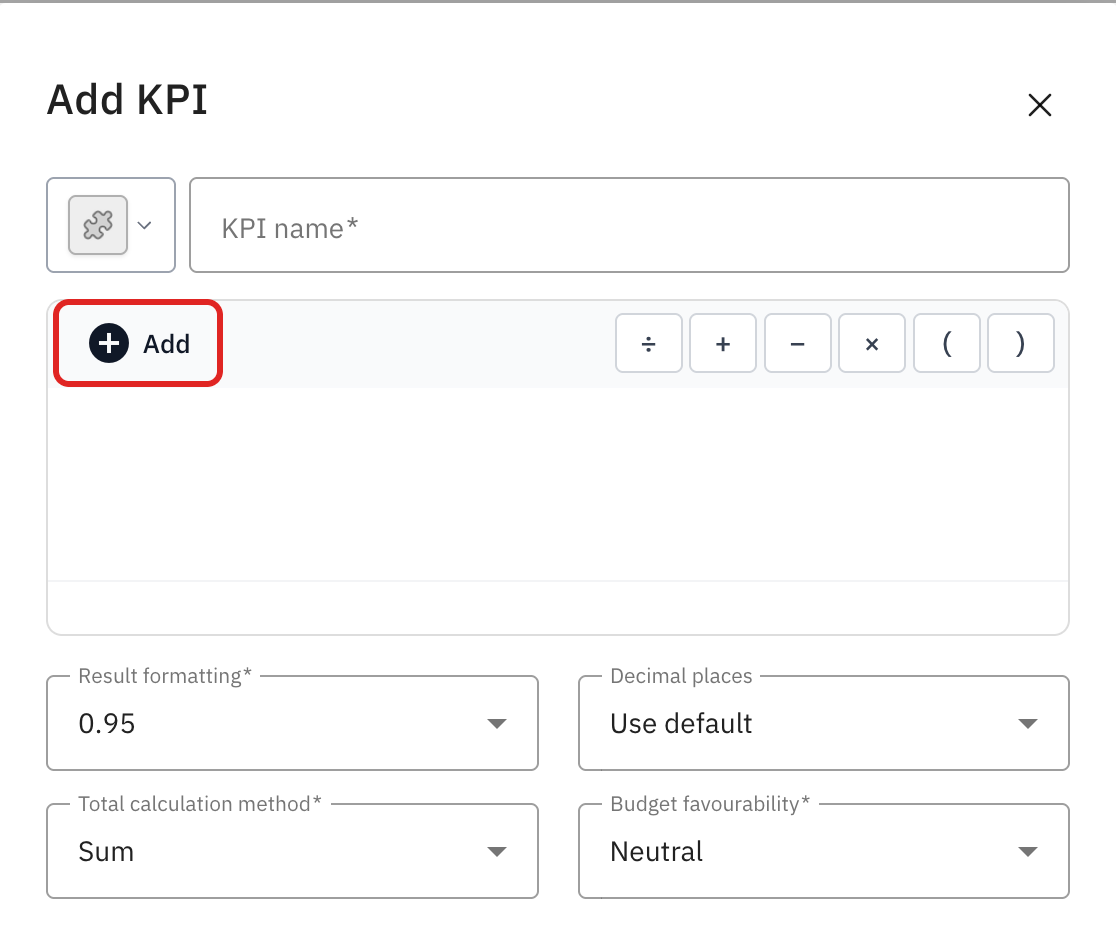
3. Give your KPI a name
4. Use Add to choose what goes into the formula, and the operator buttons to combine them
5. Set the Result formatting, Decimal places, Total calculation method and Budget favourability
6. Select Save
Making a layout section available as a KPI
1. Go to KPI Library in the left sidebar
2. Select Add KPI in the top right, then choose On an existing layout
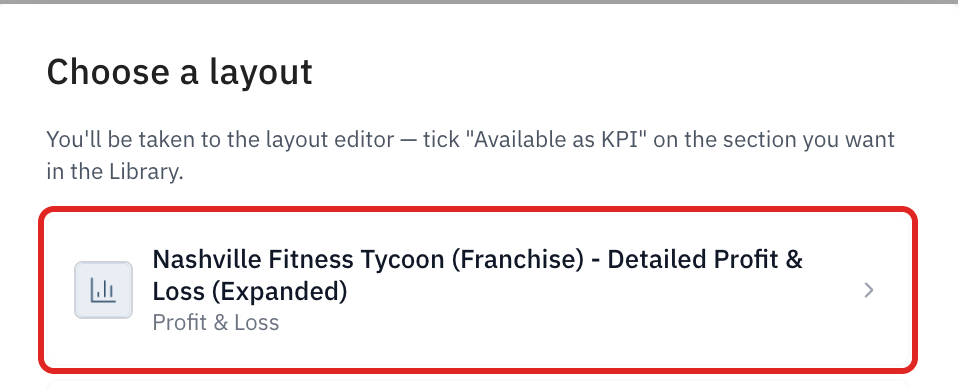
3. Choose the layout that holds the section you want
4. You are taken to the layout editor. Any group or formula that is already available carries a KPI badge
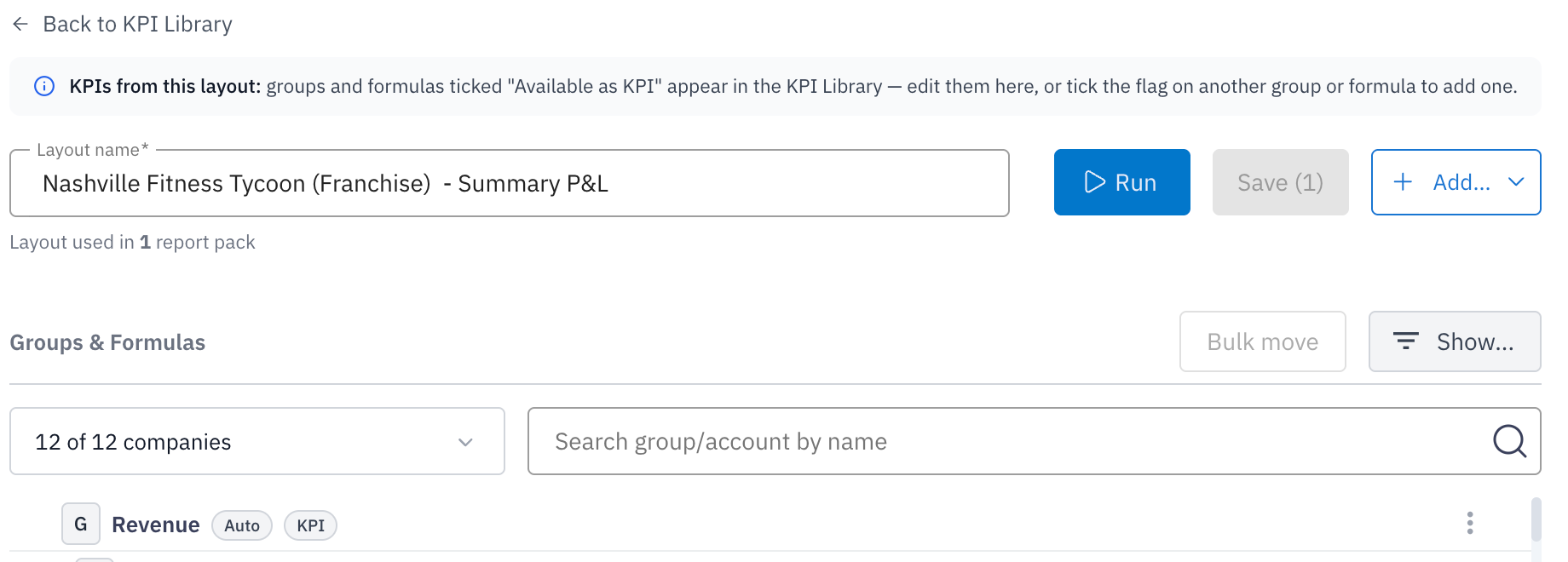
5. Find the group or formula you want, select the three dots on its row and choose Edit
6. Tick Available as KPI, then select Accept
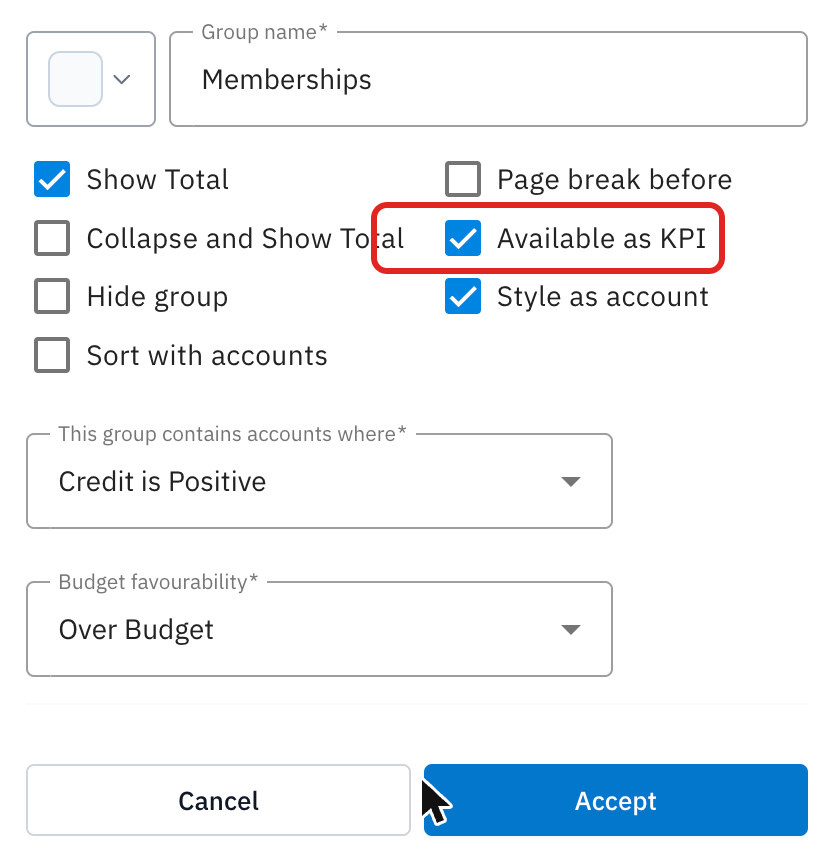
7. Select Save on the layout. Your KPI now appears in the KPI Library
Adding your KPI to a dashboard
1. Go to the Dashboard page from the left sidebar
2. Click Create widget in the top right corner

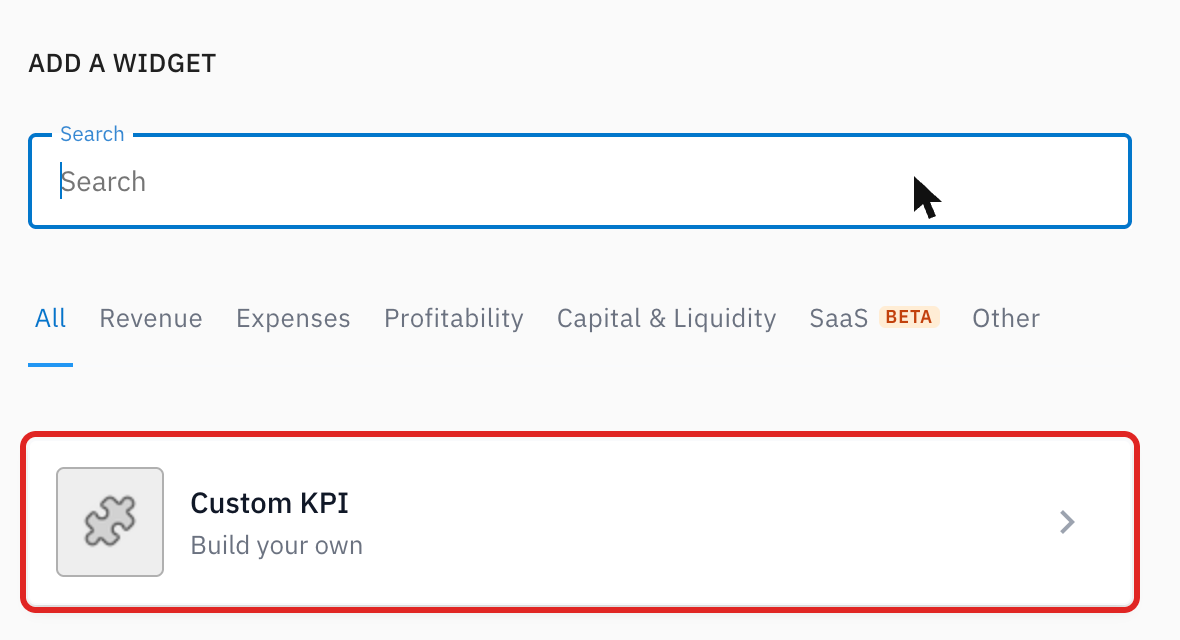
3. Select Custom KPI from the list provided
4. At the top of the panel, select the companies, currency and period that will be used for this KPI
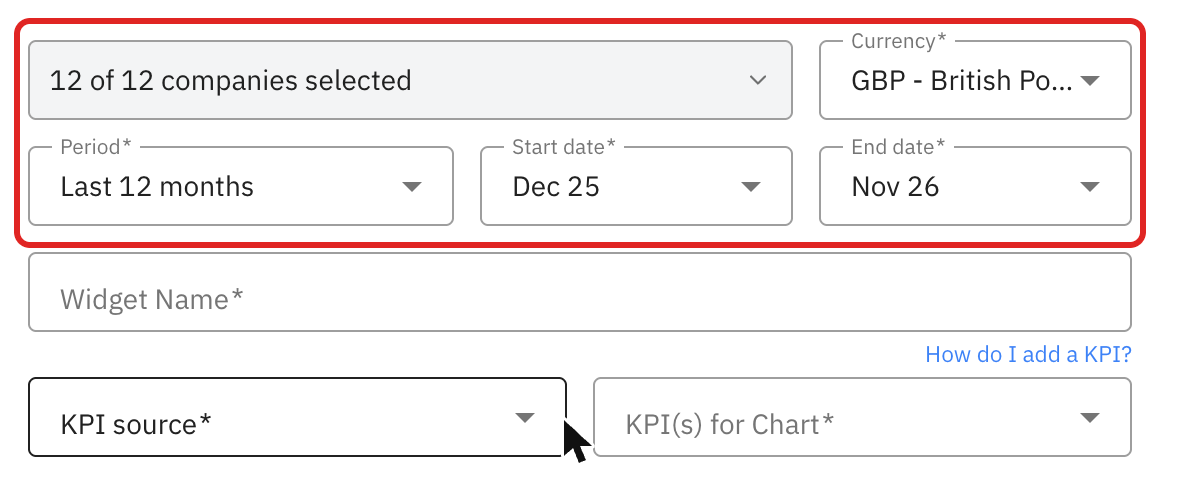
5. Enter a name in the Widget Name box
6. Click KPI source and choose where the KPI comes from, either Built-in KPI or the layout that holds it
7. Use KPI(s) for Chart to select the formula or group that you would like to display
8. Scroll down to select the chart type, display settings and compare options
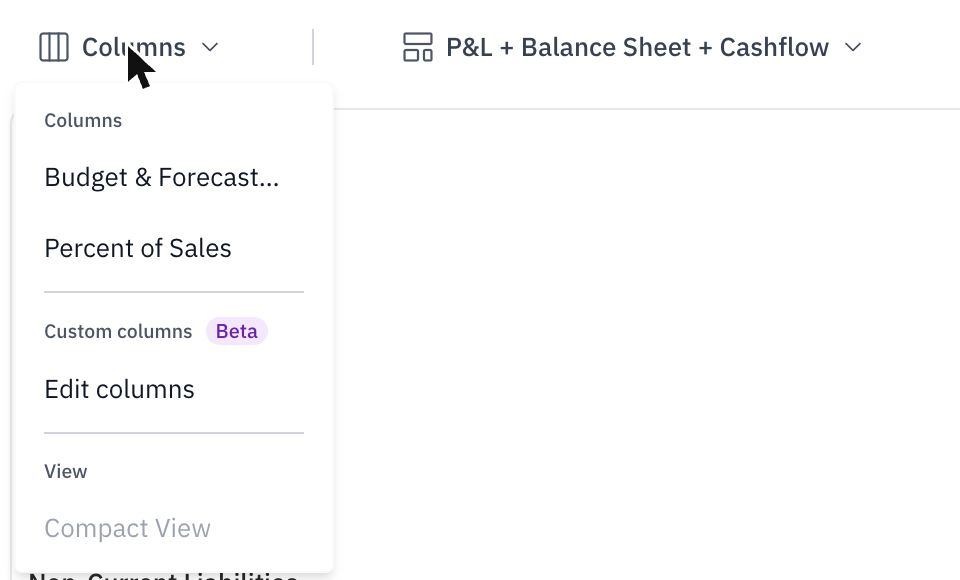
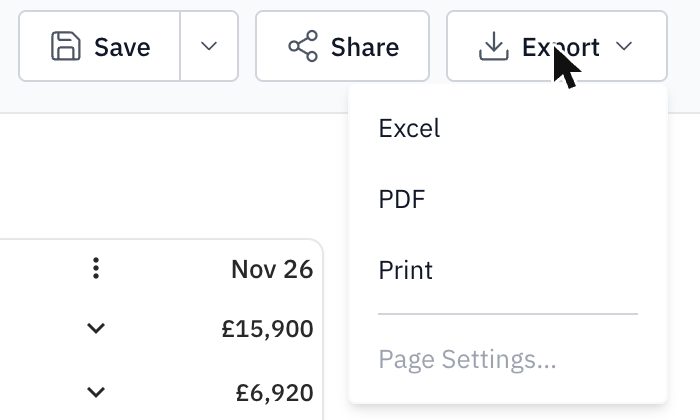
NOTE: On the report toolbar, the display options that used to sit under the toolbar are now in the Columns menu, and the download and print icons are now in the Export menu.