You can add sections of your report layouts to your dashboard, for guidance on this check out our Report Layout support article.
How to create a KPI to add to your dashboard.
1. Run a Combined Report from the left side toolbar
2. Select the Report Layouts box in the top left corner
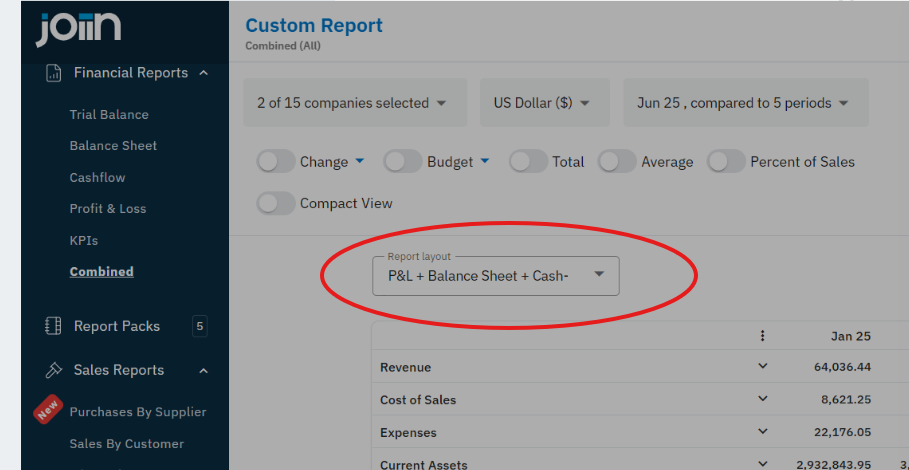
3. Either select Create or Edit to make changes to the layout

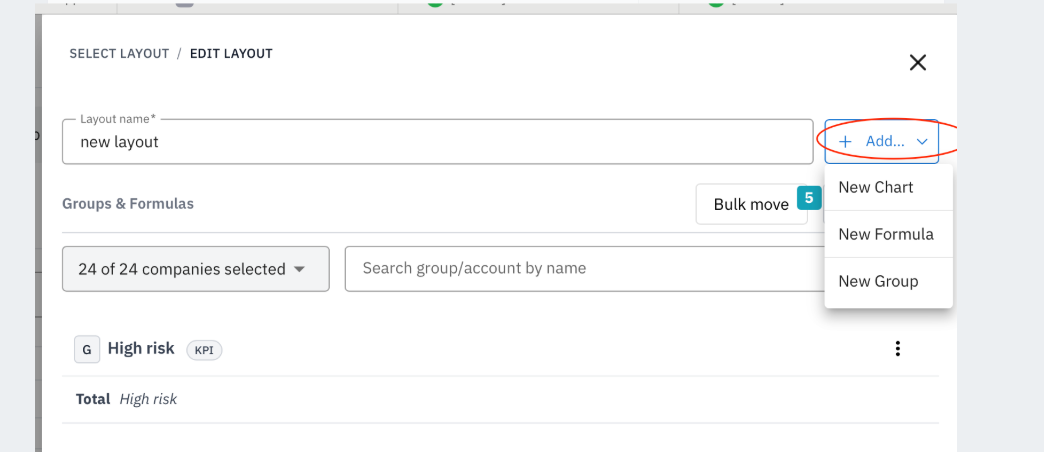
4. Now select New Group or New Formula and name it after your KPI.
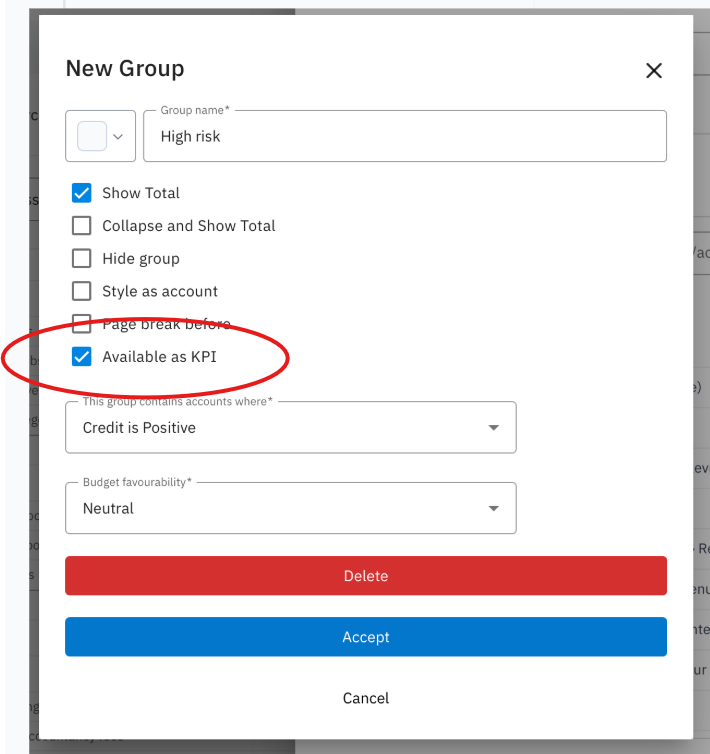
5. In your new group settings, make it available as an KPI.
6. Select relevant accounts (using the tick boxes) to move to the New KPI Group using the Bulk Move option.
You might find this support article helpful for creating KPIs using formulas.

Now you have created your KPI, follow these instructions to add it to your dashboard.
1. Go to the Dashboard page via the left side toolbar
2. Click Create New Widget in the top right corner

3. Select Custom KPI from the list provided

4. Select the dates, currency, and companies that will be used for this KPI

5. Name the KPI
6. Click the box titled KPI Source to select the custom report that you would like to take the data from
7. Use the box titled Select KPI for Chart to select the formula/group that you would like to display


8. Scroll down to select the Chart type, display settings and compare options